Low-level profiling with standard system tools
Since Spicy just emits C++ code one can use standard system tools like e.g.,
perf to collect profiling information.
In its default configuration spicyc/spicyz build in the mode they were
themself compiled in. For upstream packages this means unstripped release
binaries which expose names of called functions, but not per-line information
for e.g., perf annotate.
zeek -Cr tests/traces/http-non-default-port.pcap build/http.hlto analyzer
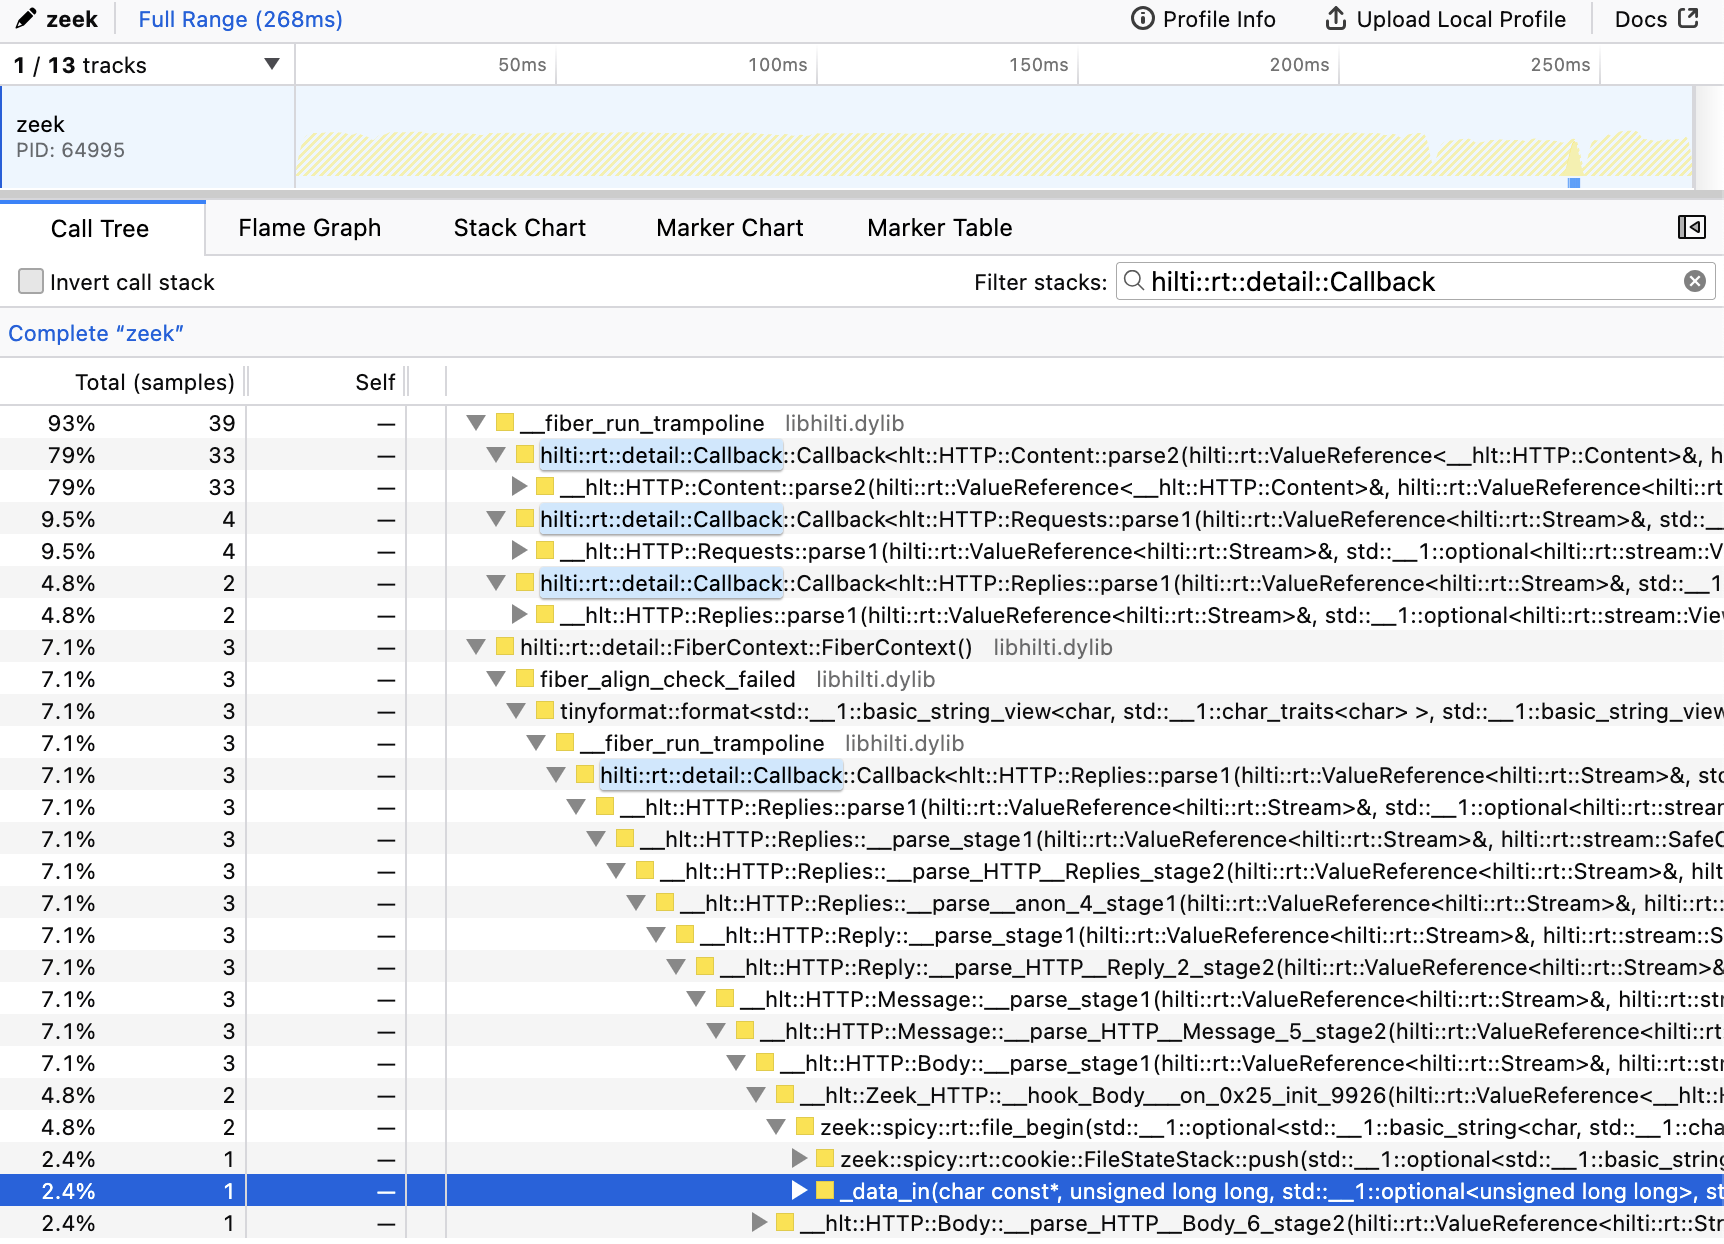
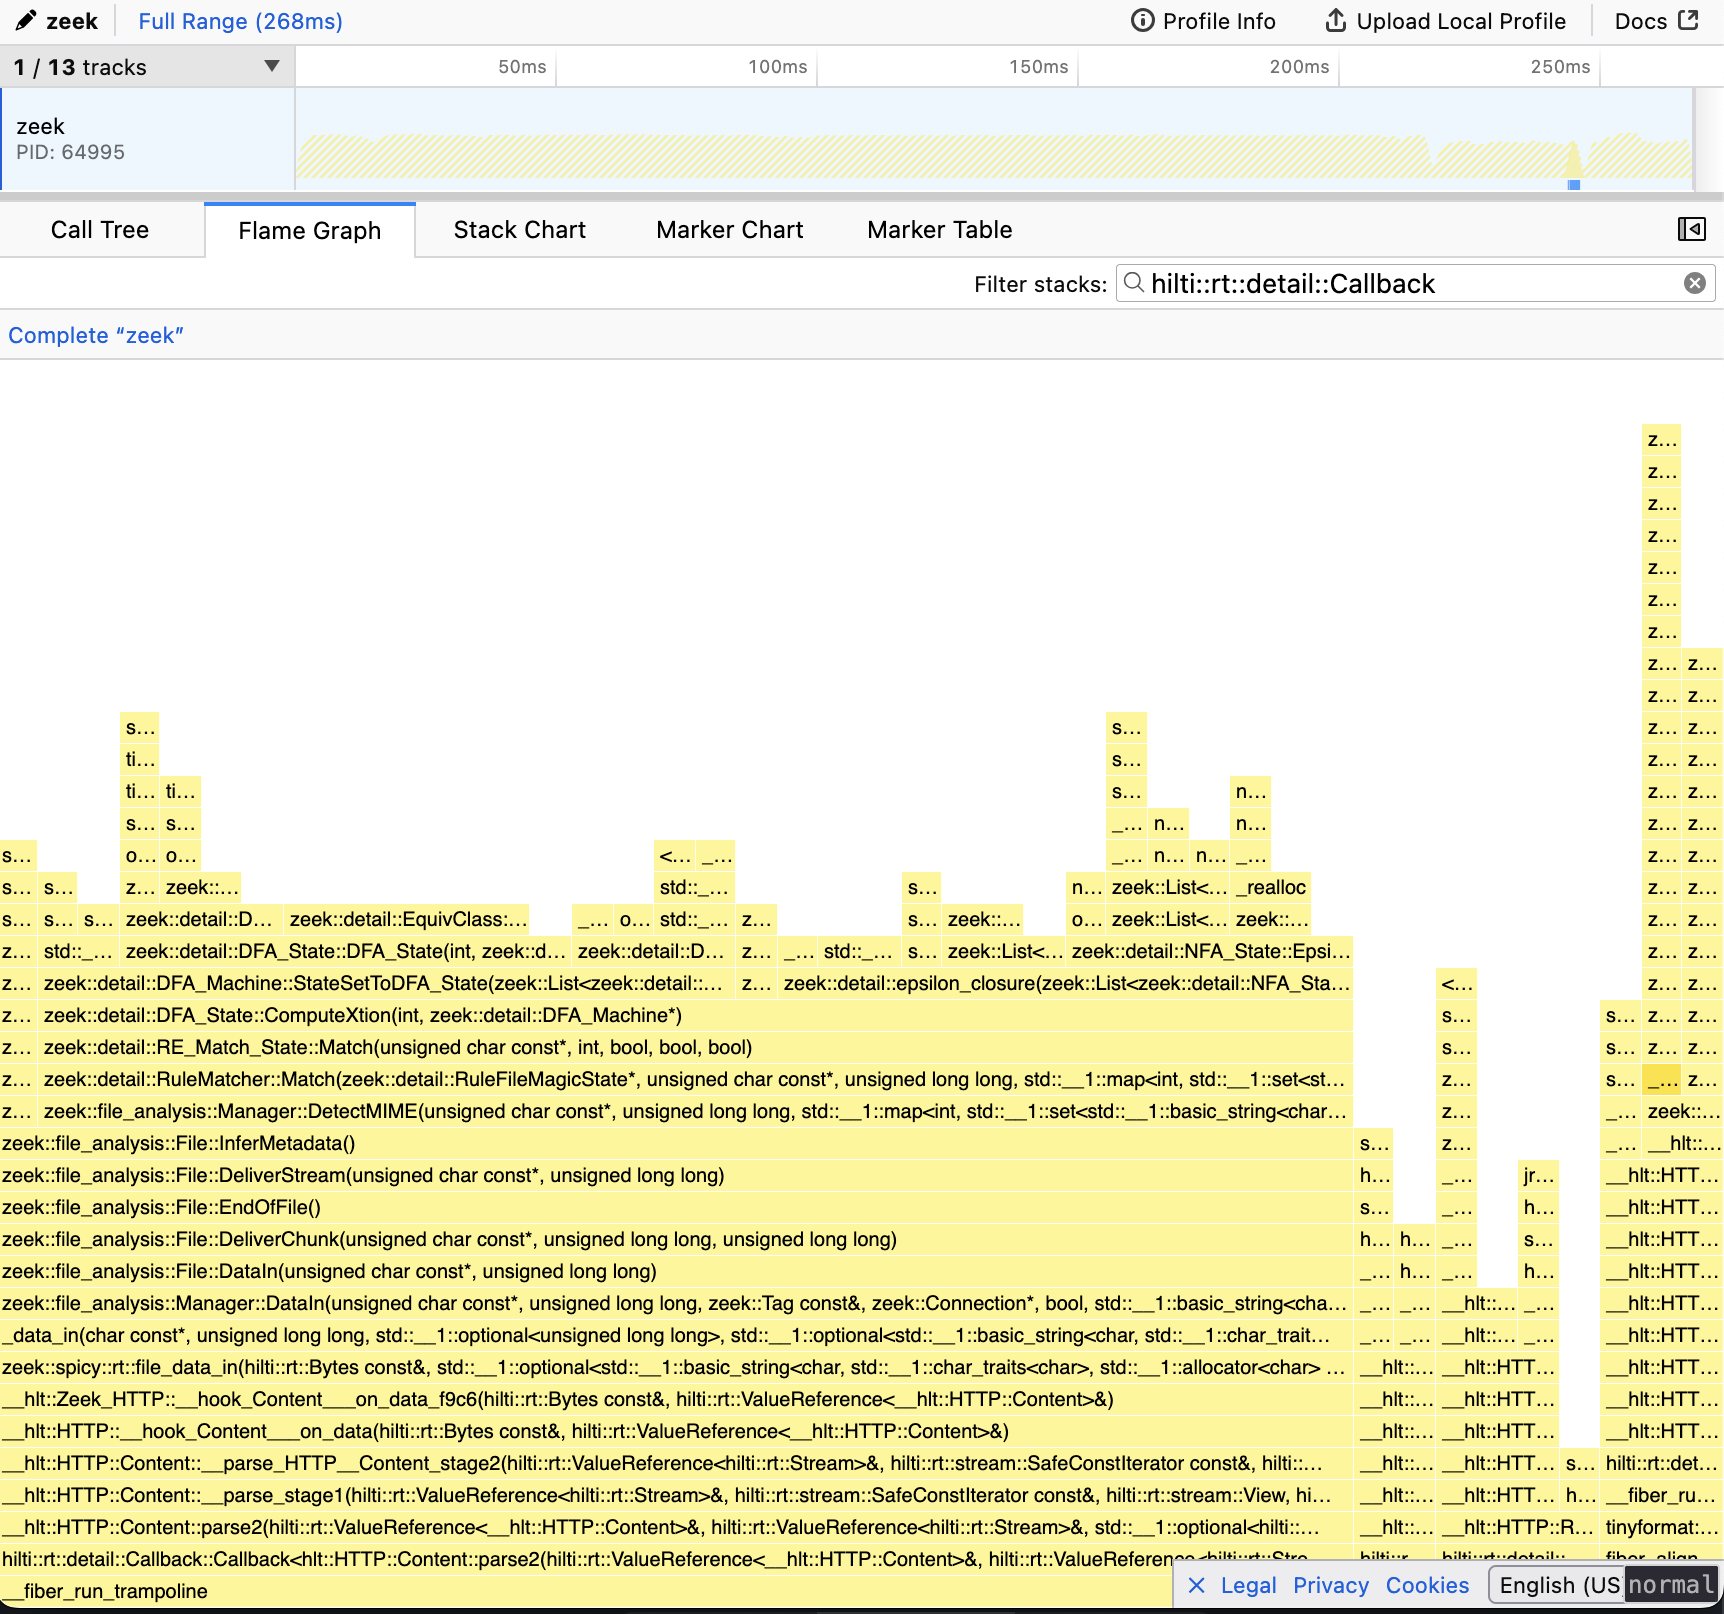
Example flamegraphs displayed with
samply zooming in on just code running
as part of Spicy parsers (<1% of total elapsed time):
Spicy parsers run on a fiber abstraction which can confuse tools like perf annotate which attempt to restore stack traces. The code to look for is
anything running below a hilti::rt::detail::Callback.